One of our research interests within ClimOp is to investigate the potential of combining strategic network planning and climate optimized trajectories in mitigating aviation’s climate impact from both CO2 and non-CO2 effects.
Strategic network planning is based on multiple decisions according to allocating fleet to routes that eventually form the entire operating network of an airline. The main objectives followed in the involved decisions are the monetary aspect of allocating each fleet type to a route and its network implication in terms of connection passengers fed to other flights at hub by opening that route. On the other hand, considering the climate impacts of the flights while planning an airline’s network is believed to be a helpful step to mitigate the aviation climate footprint at the airline level.
Climate optimized trajectories intend to address aviation climate effects from non-CO2 emissions, e.g., NOx and H2O, and the contrail formation. These non-CO2 effects follow strong temporal and spatial patterns and depend on local weather situations. Therefore, the climate-optimized trajectories aim to avoid flying through those regions of the atmosphere, which are particularly sensitive to aviation emissions, hence mitigating aviation’s climate impact.
Air traffic simulator-AirTraf
To perform global air traffic simulations while including the effects of local weather conditions, an air traffic simulator called AirTraf is used. AirTraf is a sub-model of the ECHAM5/MESSy Atmospheric Chemistry (EMAC) model. The air traffic information of AirTraf comprises Eurocontrol’s Base of Aircraft Data (BADA Revision 3.9) and International Civil Aviation Organization (ICAO) engine performance data [1].
Furthermore, the total energy model calculates fuel use and emissions based on the BADA methodology and Deutsches Zentrum für Luft- und Raumfahrt (DLR) fuel flow method. A genetic algorithm performs the flight trajectory optimization concerning routing options, e.g., cost-optimal, climate-optimal, etc. For the climate-optimal option, the information of climate-sensitive regions is described by so-called algorithmic Climate Change Functions (aCCFs).
The aCCFs are computationally inexpensive functions to estimate the climate effects of CO2, NOx, H2O, and contrail cirrus in terms of average temperature response over a time horizon of 20 years (ATR20). The Climate-optimal routing minimizes the total ATR20 induced by CO2, NOx, H2O, and contrail cirrus during the cruise condition. Figure 1 shows a schematic of climate- and cost-optimal trajectory between an arbitrary city pair.
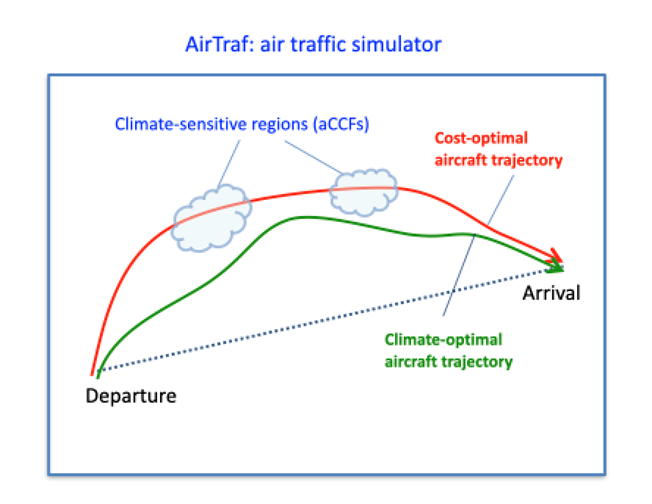
Figure 1: Illustration of an arbitrary cost-optimal (red) and climate-optimal (green) flight for a city pair calculated using AirTraf. The climate-optimal flight avoids climate-sensitive regions calculated using aCCFs based on the weather for the selected day.
Airline Operation Multi-Agent System (AOMAS) model
Regardless of the optimisation objective, every flight is characterised by an operating cost, which will be higher for, e.g., climate-optimal flights compared to cost-optimal flights. Since airlines rely on maximising profit, they have specific business models associated with other metrics such as demand. Therefore, the planning of airline networks needs to be strategic and multi-disciplinary.
Consequently, incorporating climate impacts in network planning requires a bi-objective formulation. This approach would capture the consequences of climate impact on the monetary objective and vice versa. An Airline Operation Multi-Agent System (AOMAS) model is proposed to serve as an airline operational decisions digital twin to fulfil this goal. AOMAS is planned to incorporate critical inter-dependencies associated with network planning at the airline level.
In the network planning problem, the primary decision variables concern whether or not to fly in a specific route. Flight scheduling produces plausible aircraft rotation schedules that cover all target routes suggested by network planning and grantee the passenger connections in hub airports. These two problems are usually solved separately and sequentially, but AOMAS uses an integrated dynamic programming approach.
AOMAS uses dynamic programming (DP) to assign aircraft based on the profit of the assignment and the total amount of ATR20 for all aircraft types (provided by AirTraf calculation) in an iterative approach. The solutions from all agents (aircraft types) in each iteration will be evaluated according to the profit and ATR20 and connecting banks that provide hub and probable time conflicts. A tailored multi-agent voting algorithm was used for the evaluation process.
The model continues to assign aircraft until it is not profitable anymore or there is no aircraft available in the airline’s fleet. The aggregated solution from all iterations forms the final schedule, which contains aircraft rotation and network structure. Figure 2 shows the followed iterative framework in the AOMAS.
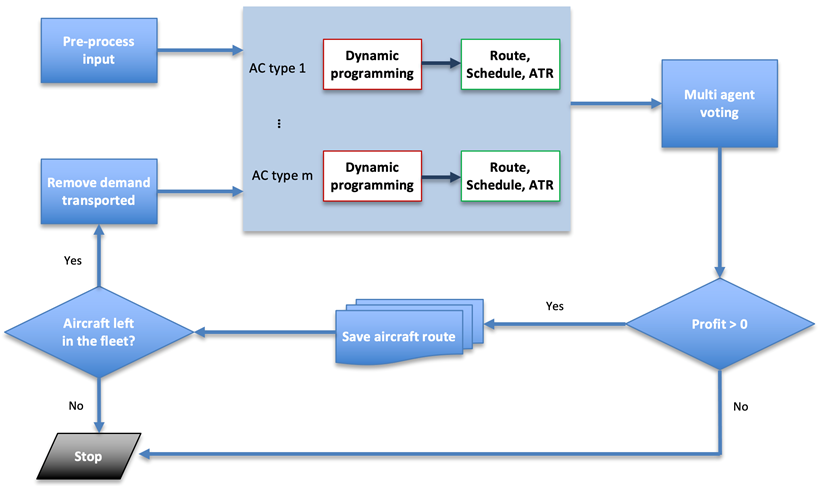
Figure 2: Schematic of AOMAS framework
Case study
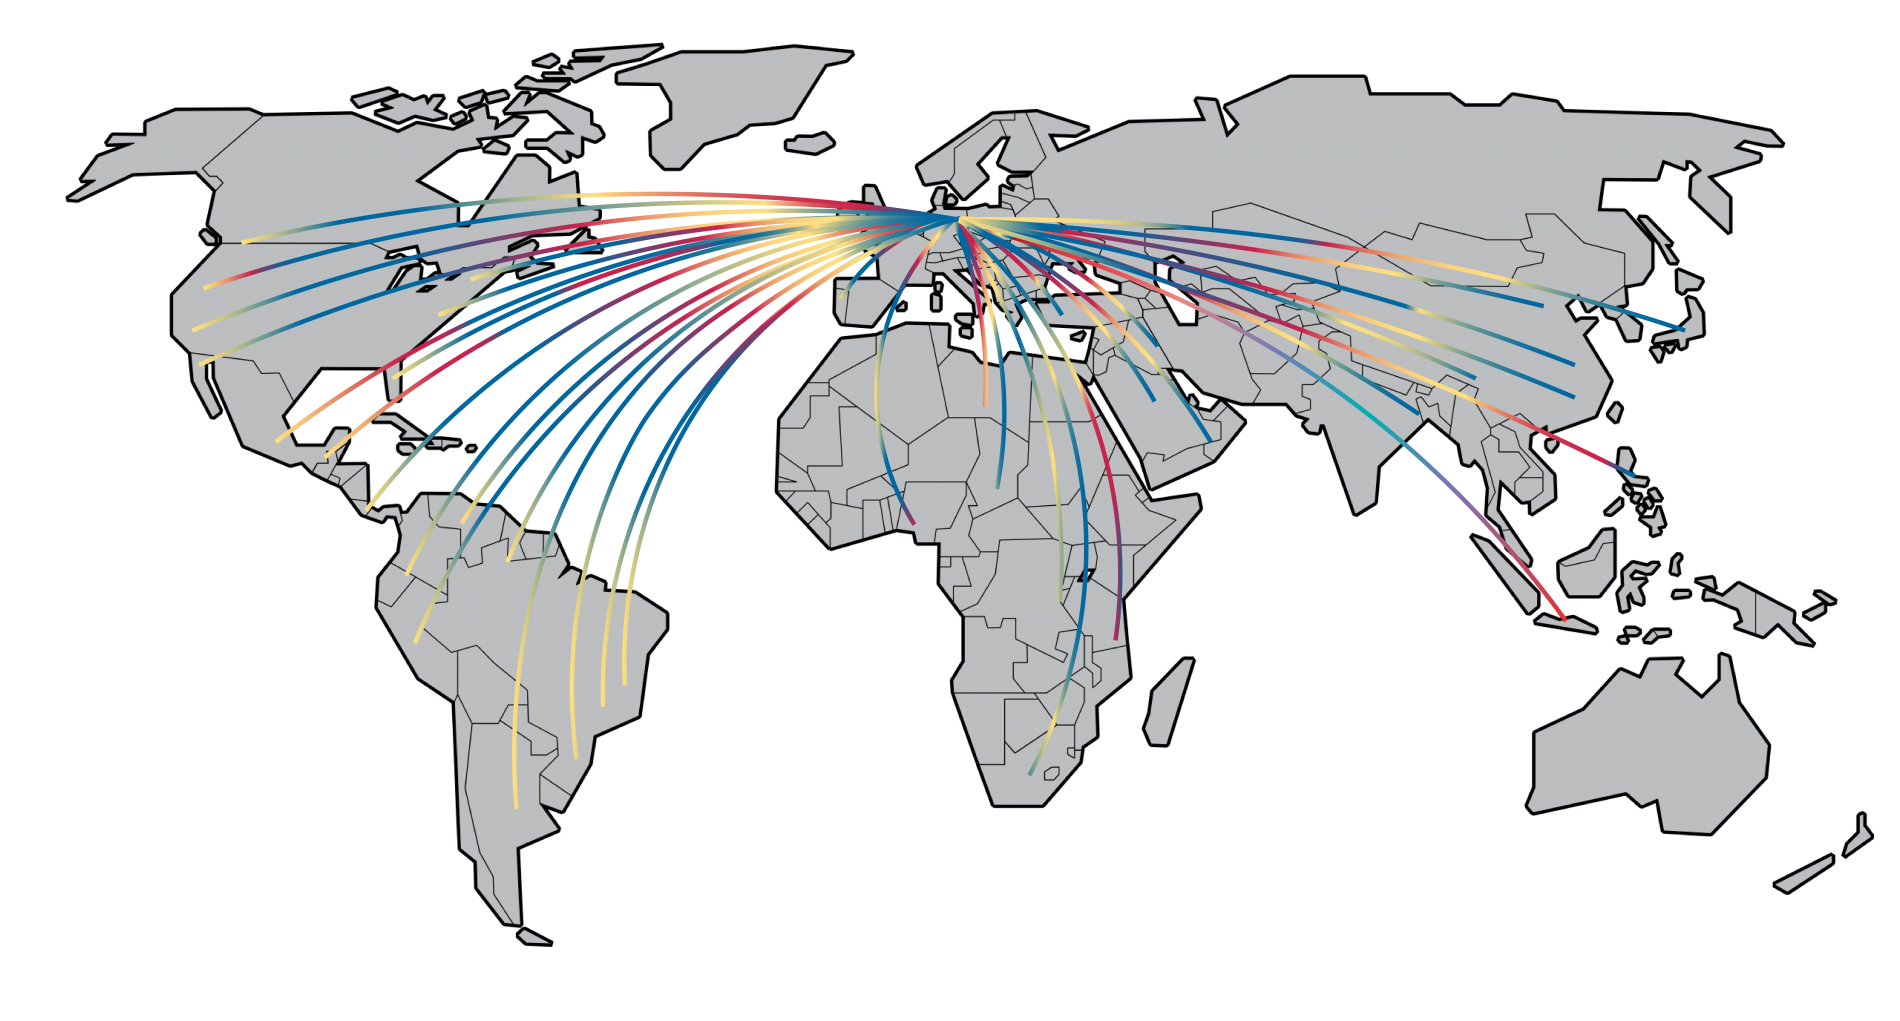
A case study is being carried out on the KLM network in the first quarter of 2018. The destinations served in the target period were extracted based on the schedule database. Afterwards, ATR20 and operational costs are estimated according to all aircraft types in the fleet. Figure 3 indicates the climate-optimised trajectories from AirTraf for all the origin-destinations flown by A330 aircraft on four representative days of 2018.
The upper panel shows the lateral distribution, and the lower panel shows the vertical distribution. The climate-related KPIs depend on weather situations. We run the AOMAS for each quarter separately to adequately address this feature. One representative day in each quarter is set as a reference for weather conditions in that quarter. Representative days are chosen based on how close they are to the mean weather condition in each quarter.
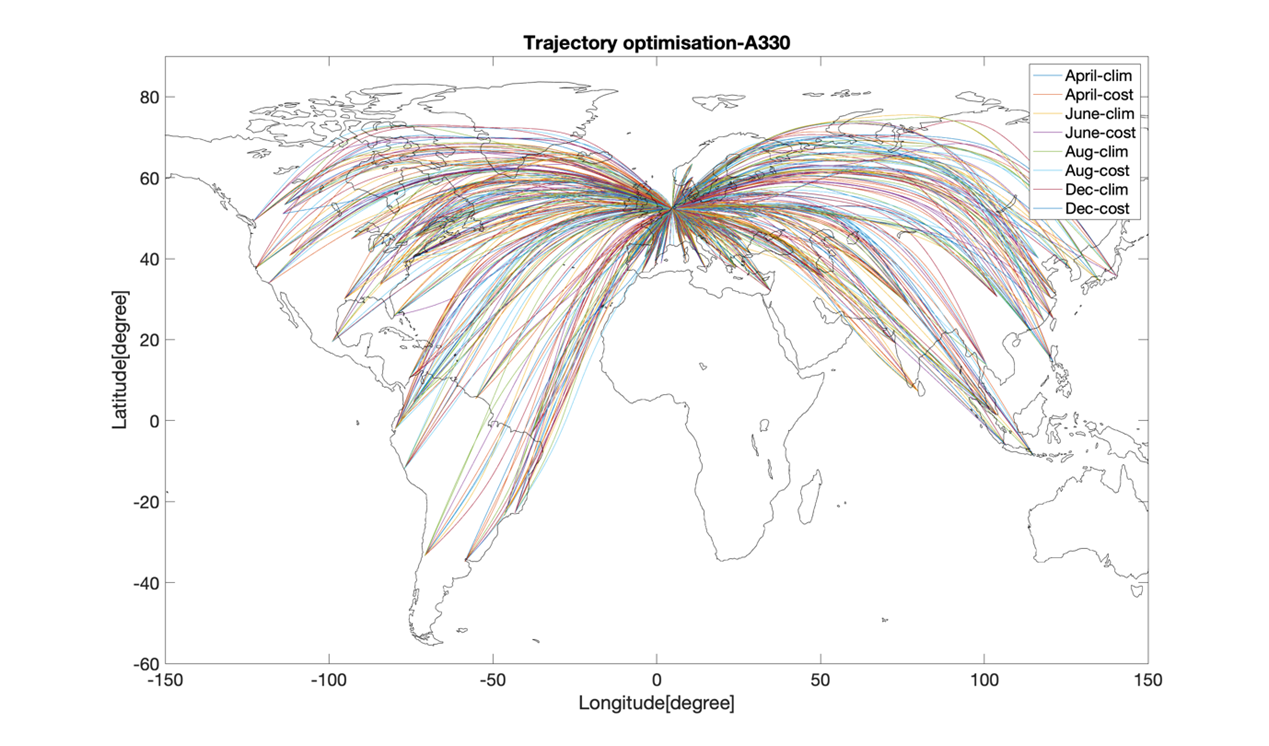
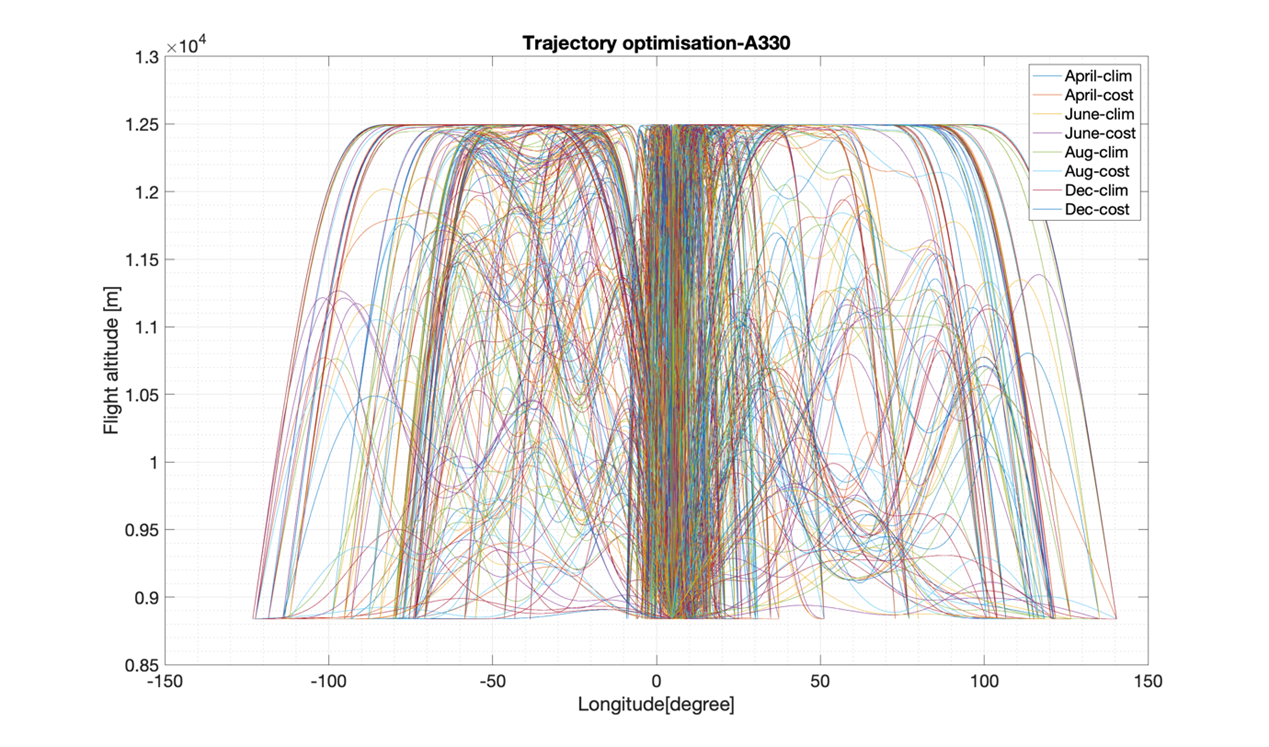
Figure 3: Climate-optimised trajectories for all destinations (using A330). The upper panel shows the lateral distribution, and the lower panel shows the vertical distribution.
The basic scenario in this case study is comparing a set of KPIs while implementing vs. not implementing this operation improvement (OI) in 2018. KPIs are, in general, categorised into climate and non-climate related KPIs. Climate-related KPIs are the mount of flight emissions and their associate ATR20. While non-climate KPIs are primarily cover the operational aspects. Operational costs, fleet utilisation, fuel flow, and flight time are the main non-climate KPIs used in this study.
Our preliminary results suggest that swapping cost-optimised with climate-optimised trajectories on average would lead to a 15% decrease in total ATR20. As ATR20 and climate-optimised trajectory calculations are highly sensitive to the weather condition, we assumed an average weather condition for each quarter of 2018 to report the results. Furthermore, a distribution for the difference in the flight time in climate-optimised and cost-optimised trajectories in extreme summer and an extreme winter day is calculated.
Figure 4 shows the histogram of differences in flight time. The maximum difference is 4%, and on average, flying in a climate-optimised trajectory would take 2.2% more in terms of the flight time.
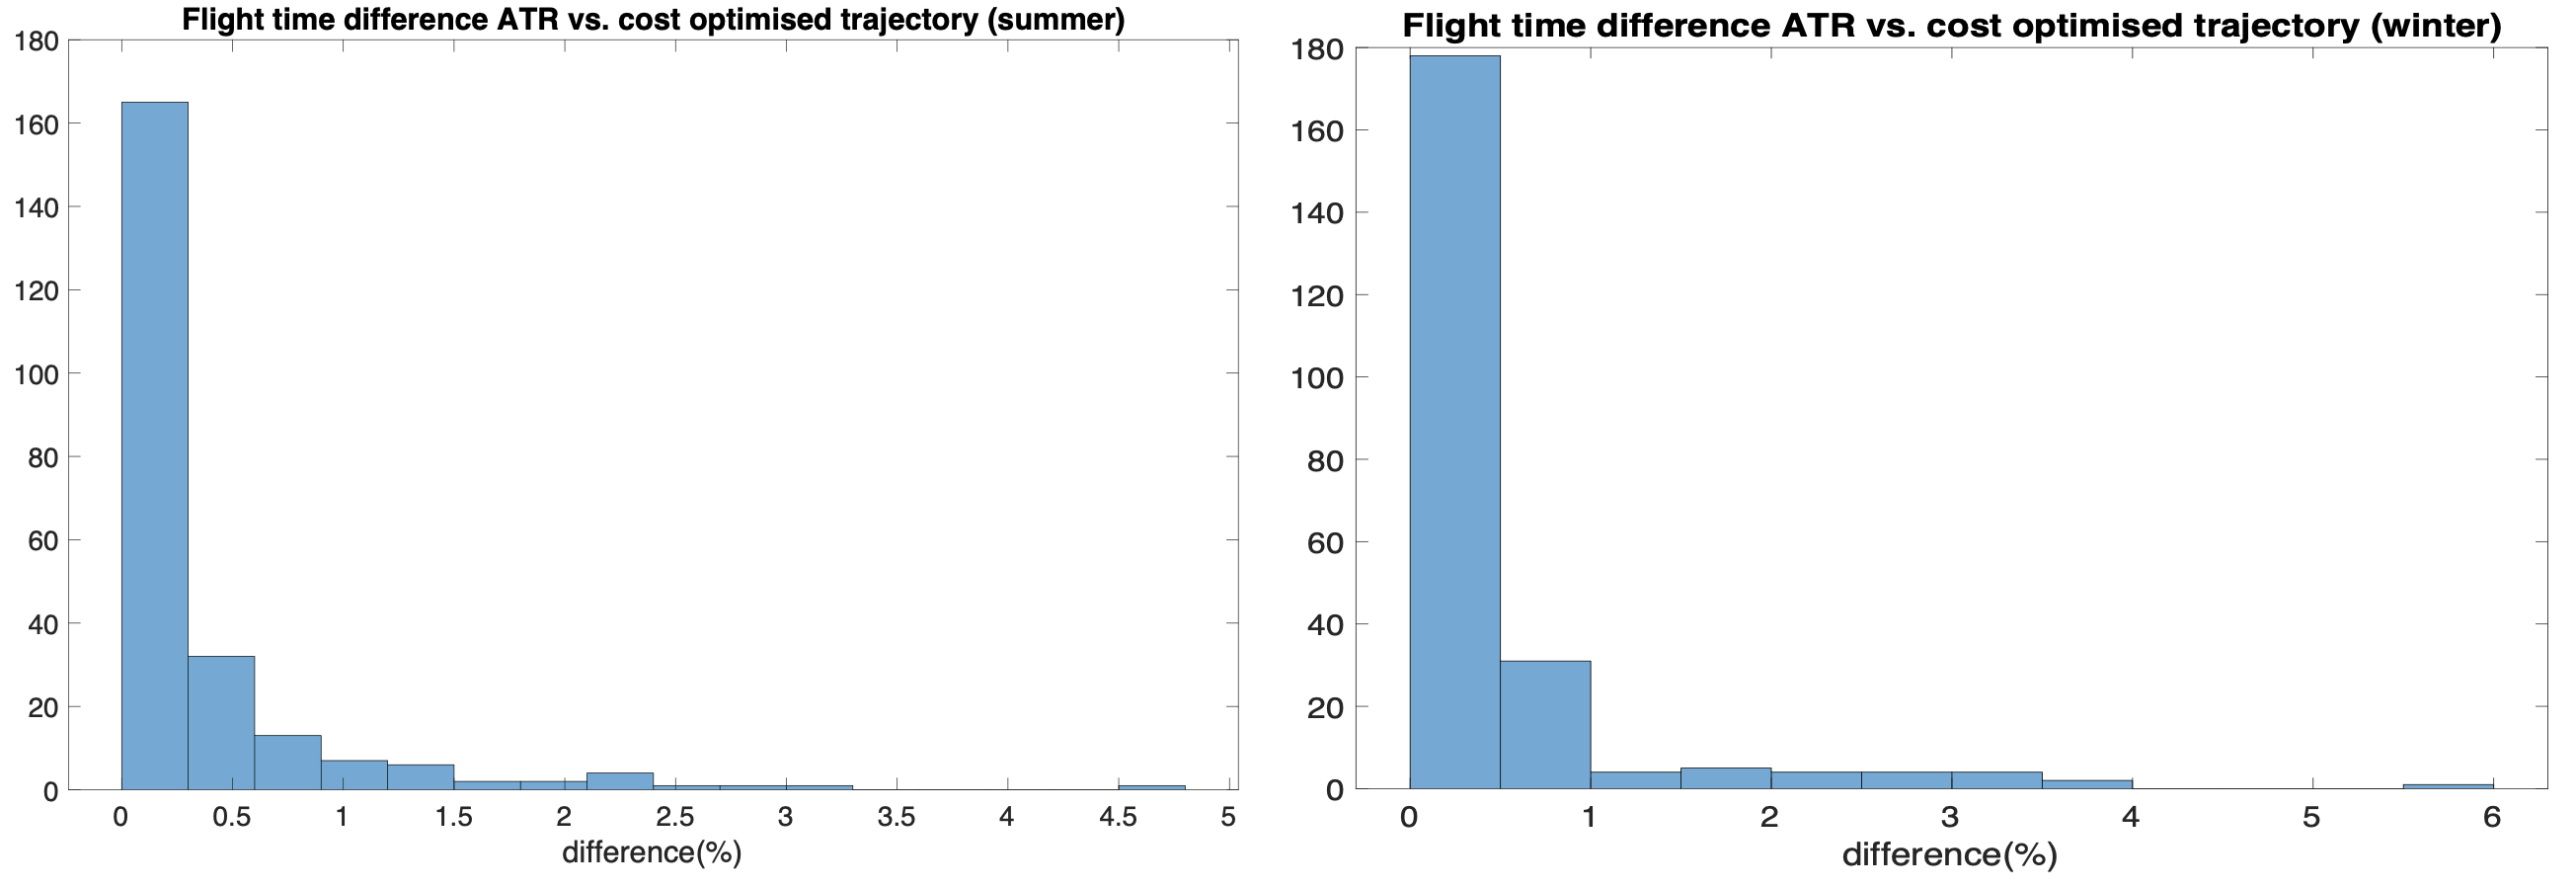
Figure 4: Relative flight time difference in ATR-optimised vs. cost-optimised trajectories (KLM-A330)
Discussions
One fundamental assumption here is considering the change in the airline operation strategy because of implementing this OI. This assumption is limiting this OI to be used for future years because tracing the changes in airlines’ operational strategies depends on not only the changes due to implementing OI but also changes in demand and market share of the airline. As modelling demand and market share evolution in future years are out of the scope of this study, we will focus on the modelling changes and measure their implications within 2018.
We expect that employing climate-optimised trajectories would not change the network structure as the maximum increase in flight time is 4% compared to cost-optimised. Our next step in this research will be to decrease the total ATR value further than it could be achieved by operating in climate-optimised trajectories. This would be possible by adjusting the network configuration according to ATR20 and profit.
Another alternative would be implementing intermediate stop-over in the applicable routes to reduce emissions and lower ATR20. The result of total ATR20 vs. profit will be visualised in a Pareto frontier for each case study. Pareto frontier can easily indicate how much profit will be lost to gain a specific improvement in ATR20. It would help airlines choose a combination that suits them the best on their way to a greener operation.
Authors: Pratik Rao, Mahdi Noorafza, TU Delft
[1] ICAO Engine Exhaust Emissions Data. In: Technical report, Doc 9646-AN/943; 2005